Correction – 25 July 2026
This study previously reported that 1,693 of 10,299 systems (16.4%, “1 in 6”) were above the limit. That figure overstated the exceedance rate and has been corrected to 1,056 of 9,235 systems (11.4%, about 1 in 9).
What was wrong: we counted a system as “over” when its single highest PFOA or PFOS sample exceeded 4 ppt. The EPA limit is a running annual average, and EPA compares UCMR5 data to the limit by averaging the results at each sampling location. Our maximum-sample rule was also degenerate: UCMR5’s reporting limit for PFOA and PFOS (0.004 ug/L) is the same number as the 4 ppt limit, so nothing can be reported below it – which made our “exceedance rate” almost identical to a plain detection rate (1,693 vs 1,721 systems). We had flagged the max-vs-average issue in our own limitations section, but we led with the inflated number anyway. That was the error.
What changed: the study now uses EPA’s own method – the average of a full set of results at any one sampling location, over the systems that reported a full set. This reproduces EPA’s published figures exactly (PFOS 12.0% and PFOA 10.9% of large systems; 9,235 systems with a full set against EPA’s ~9,240). Every derived figure on this page, all 51 state pages, and the state rates were recomputed. The detection rate is still reported below, now labelled as what it is.
Credit: Prof. Manny Teodoro (La Follette School of Public Affairs and Nelson Institute, University of Wisconsin-Madison) caught this by independently replicating the analysis and reporting a materially lower figure. We asked him to pressure-test the method; he did, and he was right. The full reconciliation – including why his pooled-system average (6.6%) and our corrected figure (11.4%) also differ – is in the methods note and in the reconciliation script.
Every journalist and organisation we sent the original figure to has been notified directly.
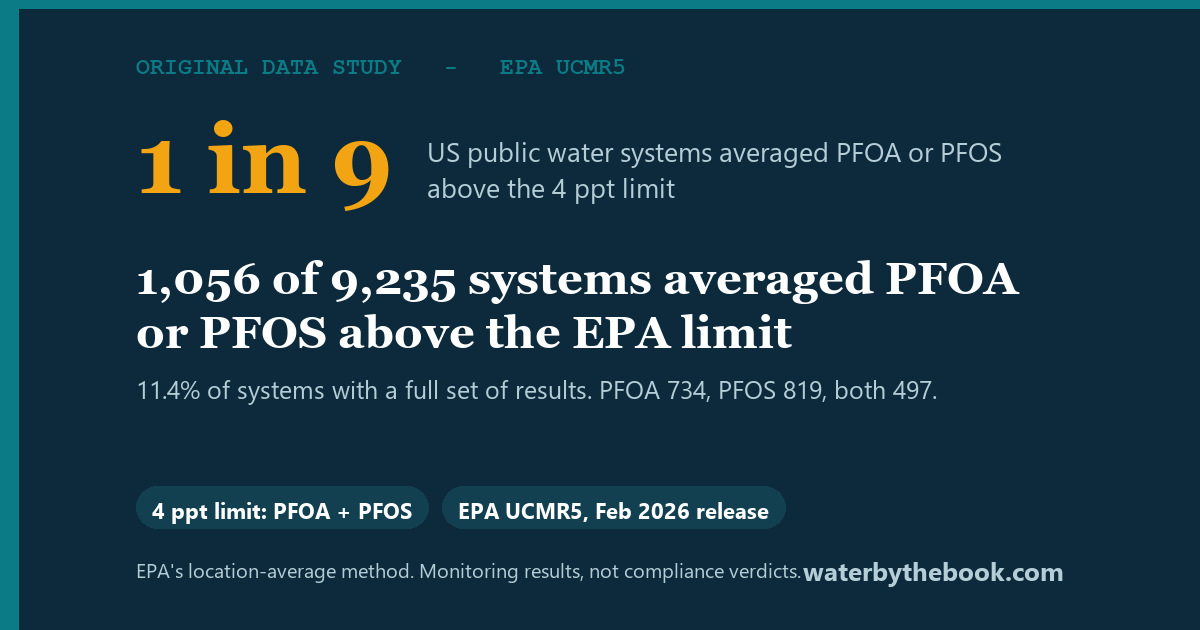
When the EPA set the first federal drinking-water limits for PFAS in 2024 – 4 parts per trillion each for PFOA and PFOS – the obvious question was: how many systems are actually over it? Now there is a national answer in the data. Of the 9,235 public water systems that reported a full set of results in the EPA’s UCMR5 monitoring, 1,056 – about one in nine – averaged PFOA or PFOS above the 4 ppt limit at at least one sampling location.
This is an original WaterByTheBook data study, computed from our own committed copy of the EPA’s public-domain UCMR5 occurrence data with a reproducible script (the numbers below regenerate from it, so they are auditable). It is not a health study and it is not a list of “unsafe” utilities. It is the honest count of where the federal record shows PFOA or PFOS above the new limit, by state and by system size, with the caveats stated plainly – because on a number this consequential, the caveats are the credibility.
The headline: Of the 9,235 US public water systems that reported a full set of UCMR5 results, 1,056 (11.4%, about 1 in 9) averaged a PFOA or PFOS result above the 4 ppt EPA limit at one or more sampling locations – 734 for PFOA and 819 for PFOS, with 497 systems over on both. Separately, 1,721 systems (16.7%) detected PFOA or PFOS at all, and PFAS of some kind was detected at 3,539 systems (34.4%). These are monitoring results, not compliance verdicts – but the scale is real and national.
What UCMR5 is (and what “above the limit” means here)
UCMR5 is the EPA’s fifth Unregulated Contaminant Monitoring Rule: a nationwide program (2023-2025) that required public water systems to test for 29 PFAS compounds and report every result to the EPA. It is the most complete national picture of PFAS in treated tap water that exists, and it is public domain. We work from the EPA’s released occurrence data, converted to parts per trillion (ppt) for comparison against the limits.
Two things matter for reading the number honestly:
- “Above the limit” means an averaged result exceeded 4 ppt – not that a utility is “in violation.” The EPA’s PFOA/PFOS limit (the MCL) is a running annual average, and the EPA states plainly that UCMR5 samples “do not indicate compliance” on their own. Following EPA’s own comparison method, we count a system as “over” when the average of a full set of results at one of its sampling locations exceeds 4 ppt. That is a flag worth knowing about, not a legal finding. We say “reported above the limit,” never “in violation” and never any health claim.
- Averages are taken within a sampling location, never across them. A system can have anywhere from one sampling location to several hundred. Averaging a contaminated entry point together with clean ones would wash out a real problem, so each location is averaged on its own and a system counts if any location is over. This is what EPA does, and it is the main reason our figure (11.4%) sits above a pooled system-wide average (6.6%).
- Non-detect means non-detect. A system with no PFOA detection is below the reporting limit, not “zero.” Non-detects enter an average as zero – EPA’s own substitution – but are never reported as measurements. Worth knowing: UCMR5’s reporting floor for PFOA and PFOS is 4 ppt, the same number as the limit, so nothing can be reported below the line at all. That is exactly why a count of systems with any detection (16.7%) is not an exceedance rate, and why this study no longer presents it as one.
The grading line itself is the EPA’s, kept as auditable data (limit + basis + as-of) because the PFAS rule is a moving target: the PFOA/PFOS 4 ppt limits were retained in the 2025-2026 reconsideration, while the 10 ppt limits for PFHxS, PFNA, and GenX were proposed for rescission. So we lead with the two settled limits and report the others separately.
Where the rules stand (as of July 2026) – read this before citing the number
Because this study is being read during an open federal comment window, the rule status matters as much as the count:
- The 4 ppt PFOA/PFOS limits are final law (set in the April 2024 rule) and the EPA proposed on May 18, 2026 to keep them while extending the compliance deadline from April 2029 to April 2031 (compliance-extension rule, docket EPA-HQ-OW-2025-1742). That means no system is out of compliance on the 4 ppt line today – the deadline has not arrived. “Reported above the limit” here describes monitoring results measured against the standard, not a missed obligation.
- The 10 ppt limits for PFHxS, PFNA, and GenX (HFPO-DA), and the Hazard Index for mixtures, were separately proposed for rescission (rescission rule, docket EPA-HQ-OW-2025-0654). Our headline never counts them: the 1,056 is PFOA-or-PFOS only. The three proposed-for-rescission compounds are tallied separately below, and the Hazard Index is not counted anywhere in this study – so the headline is unaffected however the rescission resolves.
- Both proposals took public comment through July 20, 2026 (virtual hearing July 7). Our reader explainer of the rule change is at /new-epa-pfas-limits-2026/.
What we found
About 1 in 9 systems over the limit, a third with some PFAS
The clean, defensible headline is the 4 ppt count on EPA’s method: 1,056 systems (11.4%) over for PFOA or PFOS. Step back to any of the 29 PFAS at any level and 34.4% of systems (3,539) had a detection – PFAS is common in US tap water; the question is the level. Broken out by the two current-limit compounds:
- PFOS averaging above 4 ppt: 819 systems (8.9%)
- PFOA averaging above 4 ppt: 734 systems (7.9%)
- Both PFOA and PFOS over: 497 systems
Three numbers are easy to confuse here, so they are stated side by side: 11.4% of systems averaged over the limit (the headline), 16.7% detected PFOA or PFOS at any level (a detection rate – and because the reporting floor equals the limit, every detection is at or above 4 ppt), and 34.4% detected any of the 29 PFAS. Only the first is an exceedance rate.
The three proposed-for-rescission compounds add far fewer over-limit systems (PFHxS 64, PFNA 9, GenX 3), which is part of why the rescission is being debated – but it is also why the PFOA/PFOS number is the one that matters.
Bigger systems report it more often – because they look harder
Large systems were about twice as likely to average over the limit as small ones: 15.2% of large systems (628 of 4,124) versus 8.4% of small systems (428 of 5,111). (EPA’s own published figures for this dataset are 15.3% of large systems and 7.3%-8.6% of the smaller tiers, counting all five PFAS limits – our per-tier numbers land where EPA’s do.) (UCMR5 uses two size buckets: “large” is a system serving more than 10,000 people; “small” is everything else in the dataset.) The honest reading is not “small-system water is safer.” Large systems serve denser, more industrial areas and run more thorough monitoring; smaller systems test less and UCMR5 only sampled a fraction of the smallest ones at all. The gap is as much about how hard each tier looked as about what is in the water.
The map is lopsided – and partly a map of who tested
By raw count, the most over-limit systems are in Florida (123), California (119), and New Jersey (109), followed by Pennsylvania (89), Massachusetts (67), and North Carolina (63). By rate (among states with at least 30 systems reporting a full set), the picture is starker:
| State | Systems over 4 ppt | Share with a full result set |
|---|---|---|
| New Jersey | 109 / 247 | 44.1% |
| Connecticut | 27 / 62 | 43.5% |
| Delaware | 12 / 36 | 33.3% |
| Florida | 123 / 380 | 32.4% |
| South Carolina | 42 / 134 | 31.3% |
| Massachusetts | 67 / 251 | 26.7% |
| Pennsylvania | 89 / 358 | 24.9% |
These rates reflect two things at once, and conflating them would be the easy mistake: real regional contamination (the Northeast and parts of the Southeast have documented PFAS sources) and testing intensity (states like New Jersey set their own PFAS limits years before the federal rule and sample aggressively, so they both find and report more). A high rate means “a lot of the tested systems there were over,” not “your water there is the worst in the country.” We report the rate with its denominator so you can see exactly what it is built on.
Which PFAS show up most
The most frequently detected compounds are not always the regulated ones: PFPeA (2,032 systems), PFBA (1,893), PFHxA (1,778), and PFBS (1,674) lead on detection frequency, with the two limited compounds PFOS (1,336) and PFOA (1,288) close behind. Most of those short-chain detections are at low levels with no individual federal limit – detection is common; an over-the-limit result for PFOA or PFOS is the meaningful subset.
Limitations (read these before you cite the number)
- UCMR5 is ~95% complete as of the data release; the EPA finalizes reporting in 2026. The counts will shift modestly when we re-ingest the final data; the script makes that a one-command refresh.
- It is not every system, and the 11.4% is a rate among the systems that reported a full set of UCMR5 results – not the full universe. UCMR5 covers every system serving 3,300+ people plus only a small random sample of the smallest, and no private wells. There are roughly 50,000 US community water systems, the great majority of them small – and small systems show the lower over-rate (8.4% vs 15.2%). So the all-systems share is likely lower than 11.4%; read “about 1 in 9” as “of the systems serving most Americans,” not a random sample of every US system. EPA publishes a weighted national estimate that adjusts for this uneven sampling and counts all five PFAS limits plus the Hazard Index: 8.0%. If you are on a well, this study says nothing about your water; test it.
- An average-above-limit is a flag, not a verdict. Real compliance is determined from a running annual average of quarterly samples reported to the state primacy agency, over a monitoring period that has not begun. A UCMR5 location average over the line does not establish noncompliance, and a system over it may already be treating for it. This is a flag for attention, not a compliance tally.
- Different reasonable methods give different numbers, and we now show our work. Averaging every sample across a whole system into one figure gives 6.6%; EPA’s per-location method gives 11.4%; counting each system’s single highest sample – the method this study used until 25 July 2026 – gives 16.4%, which is why it was corrected. The reconciliation script reproduces all three from the raw EPA file so any data desk can check the difference itself rather than take our word for it.
- Compliance is not yet required. The 4 ppt MCLs are final law, but systems are not required to comply until April 2029 (proposed extension to April 2031). Nothing in this study describes a legal failure by any utility – it describes what the monitoring record shows against the standard that is coming.
- Rates mix contamination and monitoring. See New Jersey above. We give every rate its denominator for exactly this reason.
- This is a count of the federal record, not a measurement of risk to any individual tap.
How to check your own system
A national number is a starting point, not an answer about your house. The point of the data is that it is per-system: you can look up the utility that serves your ZIP and see its actual UCMR5 PFAS results, graded against these same limits, in the WaterByTheBook water watchdog. If your system is one of the 1,056, the next question is the filter that actually removes PFOA and PFOS – a certified NSF/ANSI 53 or reverse-osmosis unit, verified by the exact model. For the broader picture, see our lead study and the beyond-PFAS-and-lead study, and the PFAS contaminant guide for how each filter type is tested.
Methodology + source
- Source: EPA UCMR5 occurrence data (2023-2025), the public-domain federal monitoring dataset (~95% complete as of the 2026 release). License: US Government work, no reuse restriction.
- Method (EPA’s own): For each sampling location that reported a full set of UCMR5 results – two semi-annual samples for a ground-water location, four quarterly for surface water – we averaged the results, substituting zero for non-detects, and compared that average to the 4 ppt MCL. A system counts as over if any one of its locations is over; averages are never pooled across a system’s separate locations. A system enters the denominator for a limit only if it reported at least one full set for that analyte (9,235 systems for PFOA or PFOS). EPA’s significant-figures rule sets the comparison point at 4.05 ppt for the 4 ppt limits and 15 ppt for the 10 ppt limits. Tallied by state and by system size. Limits are read from an auditable framework (limit + basis + as-of), not hardcoded.
- Validation: this method reproduces EPA’s own published UCMR5 figures – PFOS 12.0% and PFOA 10.9% of large systems, 9,235 systems with a full set against EPA’s ~9,240, and 24,037 full-set sampling locations against EPA’s ~24,050.
- Method history: until 25 July 2026 this study compared each system’s single maximum sample to the limit and reported 16.4%. See the correction notice at the top.
pfas_method_reconciliation.pyreproduces the old figure, the corrected figure, and a pooled-system average from the raw EPA file, isolating the cause one variable at a time. - Reproducibility: every figure here is computed by
pfas_national_study.pyover our committed copy of the data and written topfas-national-results.json;--checkre-runs and verifies the numbers have not drifted. A regression test now pins the exceedance method itself – the location-average rule, the full-set requirement, and the comparison operator – so a future data refresh cannot silently change how the headline is computed. - Integrity: no figure is inflated, no system is named as “unsafe,” and no health or causal claim is made from a monitoring result. We report what the federal record shows – above or below the limit, dated, with the caveats.
Embeddable stat (share this finding)
About 1 in 9 US public water systems averaged PFOA or PFOS above the EPA’s 4 ppt limit – 1,056 of 9,235 systems (11.4%) with a full set of EPA UCMR5 results, using EPA’s own sampling-location average method. PFAS was detected at all at 34.4% of systems. Source: WaterByTheBook analysis of EPA UCMR5 data, waterbythebook.com.
<blockquote class="wbtb-stat">
  <p><strong>About 1 in 9 US public water systems</strong> averaged PFOA or PFOS above the EPA's
  4 ppt limit -- 1,056 of 9,235 systems (11.4%) with a full set of EPA UCMR5 results.</p>
  <cite>Source: <a href="https://waterbythebook.com/pfas-national-data-study/">WaterByTheBook
  analysis of EPA UCMR5 data</a></cite>
</blockquote>
Related guides
Beyond PFAS and Lead: About 1 in 4 US Systems Reported Another Contaminant Over a Limit
Correction (2026-06-29): a watchdog data-integrity audit corrected two things in the underlying data – the EPA Six-Year Review’s…
The 2027 EPA Lead Rule Nearly Triples the Water Systems Over the Line
Here is the honest national picture of lead in tap water, and it is not the one either…
Does a Refrigerator Water Filter Remove Lead? What NSF 53 Actually Means
Does a refrigerator filter remove lead? Sometimes – but only if that exact filter carries an NSF/ANSI 53…