Correction (2026-06-29): a watchdog data-integrity audit corrected two things in the underlying data – the EPA Six-Year Review’s TTHM total (which had been missed at ingest) is now included, and the state-DWW unit handling was normalized (nitrate/fluoride). The corrected headline is 22.5% (13,992 of 62,245 systems, about 1 in 4), up from a previously-published 17.0% (the rise is the now-included TTHM, a disinfection byproduct). Per-contaminant rates and the state table below reflect the corrected, reproducible data (see
beyond-pfas-lead-national-results.json).
PFAS and lead get the headlines, but they are not the only regulated contaminants in US tap water. So we asked the federal record a broader question: beyond PFAS and lead, how many water systems reported some other regulated contaminant over an EPA limit? The answer, from the EPA’s national compliance-monitoring data: about 1 in 4. This is the third in our original-data series, after the PFAS study and the lead study – the multi-contaminant picture, computed from the real data with a reproducible script.
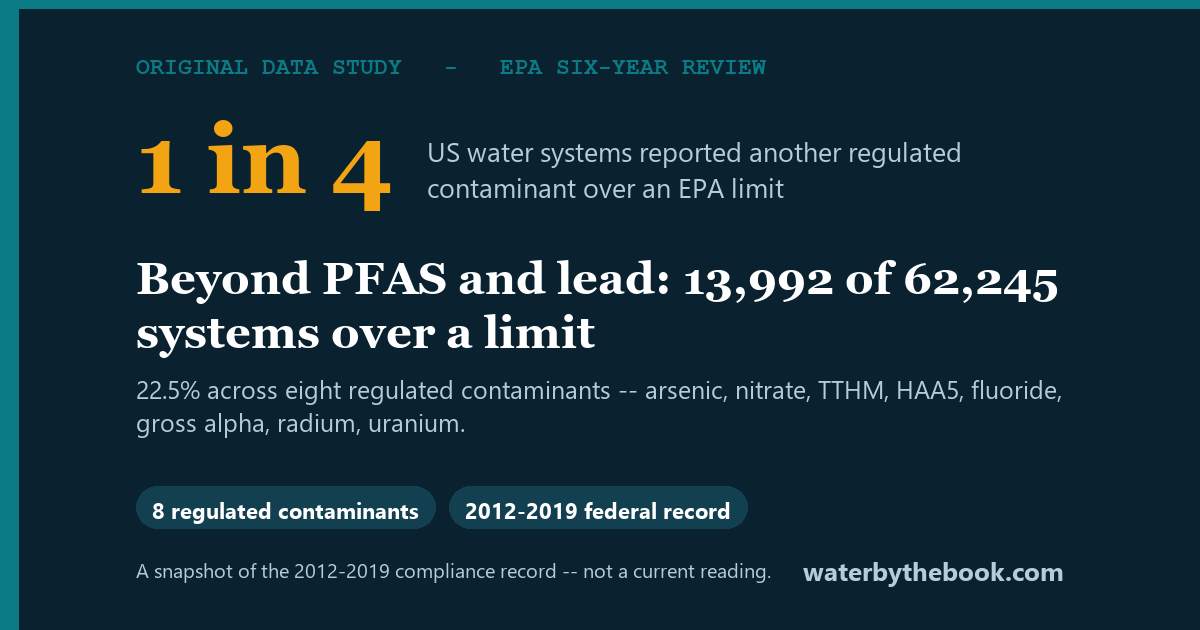
The headline: Of 62,245 US water systems that tested for at least one of eight regulated contaminants – arsenic, nitrate, the disinfection byproducts TTHM and HAA5, uranium, radium, gross alpha, and fluoride – 13,992 (22.5%, about 1 in 4) had at least one of them over the EPA limit at some point in the record. Important: this is a snapshot of the 2012-2019 federal compliance record for most systems, not a current reading.
Read this first: what the data is, and its vintage
This study draws on the EPA’s Six-Year Review – the national compliance-monitoring data that public water systems reported to the EPA – plus the current state extracts we already use (California and Florida). Two things have to be said up front:
- It is a snapshot, mostly through 2019. About 56,500 of the systems here come from the Six-Year Review record for 2012-2019; only the ~5,800 current state systems are recent. A system’s level may have changed since – through new treatment, a new source, or a lead-and-copper-style fix. Read every number as “reported, in the federal record” – not “is, today.”
- “Over the limit” is a flag, not a verdict. We count a system as “over” when its maximum reported result for a contaminant exceeded the EPA limit. For several of these (arsenic, TTHM, HAA5) compliance is judged on a running annual average, so a single high result is a reason to look closer, not an automatic violation. We say “reported above the limit,” never “in violation” and never a health claim.
What we found
Beyond PFAS and lead, a contaminant over a limit is common
Across the eight contaminants, 22.5% of the systems that tested for any of them reported at least one over its EPA limit – 13,992 of 62,245 (rates here are over the systems that tested for each contaminant, counting non-detects, not just those that found something). That is the “beyond PFAS and lead” story in one number: the other regulated contaminants, taken together, put about one in four systems over a line somewhere in the record.
One honest qualifier up front: the biggest drivers are the disinfection byproducts. The two most-flagged contaminants are TTHM (17.0% of tested systems) and HAA5 (11.5%) – both judged on a running annual average, so a single high sample is not a violation. Set the running-average byproducts (TTHM + HAA5) aside, and the share of systems over a non-byproduct contaminant (arsenic, nitrate, a radionuclide, fluoride) is 8.9% – about 1 in 11 (5,551 systems). Both numbers are real; we lead with the broad one and show you the sensitivity so you can judge.
Which contaminants, and how often
The picture is dominated by two very different families – a treatment byproduct and a natural element. Each rate is over the systems that reported a result for that contaminant (coverage differs by contaminant):
| Contaminant (EPA limit) | Systems over the limit | Of systems tested |
|---|---|---|
| HAA5 – haloacetic acids (60 ug/L) | 5,044 | 11.5% |
| Arsenic (10 ug/L) | 2,623 | 5.1% |
| Nitrate (10 mg/L) | 1,412 | 3.1% |
| Combined radium (5 pCi/L) | 928 | 3.9% |
| Gross alpha (15 pCi/L) | 922 | 4.7% |
| Uranium (30 ug/L) | 422 | 2.2% |
| TTHM – trihalomethanes (80 ug/L) | 7,942 | 17.0% |
| Fluoride (4.0 mg/L) | 261 | 0.5% |
(TTHM is now included from the Six-Year Review national extract – the total-THM record – alongside the current California and Florida data, so its rate is national like the others.)
Two takeaways. The biggest contributors are the disinfection byproducts (TTHM at 17.0% of tested systems, then HAA5 at 11.5%), which are the chronic-risk side of the deliberate tradeoff that keeps pathogens out of the water – not a contaminant added to the water, but one formed by treating it (and judged on a running annual average, as noted above). And arsenic, a natural, odorless, serious contaminant, is over the limit at about 1 in 20 systems that tested for it – the marquee “beyond PFAS and lead” finding. Nitrate and fluoride exceedances are comparatively rare, and the radiological contaminants (radium, uranium, gross alpha) sit in the low single digits.
Where the exceedances are
By state, the systems with an exceedance are concentrated where the geology and the treatment challenges are toughest:
The six states with the most systems over a limit:
| State | Systems over a limit | Of systems tested |
|---|---|---|
| California | 1,618 | 30.4% |
| Texas | 1,424 | 26.0% |
| New York | 641 | 20.6% |
| Pennsylvania | 605 | 18.1% |
| Florida | 594 | 24.5% |
| Oklahoma | 594 | 49.5% |
Read these rates with care: a state’s number reflects real occurrence, how much the state tested and reported, and data vintage all at once. California and Florida have current state data merged in where it exists – though even those still include 2012-2019 systems with no current extract (about a fifth of California’s row and a third of Florida’s); the rest of the table is the 2012-2019 record. And by rate, smaller states with high-arsenic or high-radionuclide geology stand out more sharply – Oklahoma (594 systems, 49.5%) and several others run well above the big states. None of this is a verdict that any state’s water is “the worst”; it tracks geology plus how thoroughly each state tested.
Limitations (read these before you cite the numbers)
- It is a 2012-2019 snapshot for most systems, not current. This is the single most important caveat. Treat it as the federal record through ~2019.
- Per-contaminant denominators differ. Six-Year Review coverage varies by analyte (e.g., far more systems tested for nitrate than for radium in this extract), so every rate is over the systems that reported that contaminant – never all systems.
- Max-detected, not compliance. We use each system’s highest reported result; several MCLs are running annual averages, so this counts more systems than a compliance tally would.
- We dropped implausible values. A small number of normalized results above a per-contaminant ceiling were treated as likely data-entry errors and excluded (e.g., 11 fluoride, 5 each for HAA5 and uranium).
- Scope. This covers the ~62,000 systems in the federal compliance-monitoring record plus the current state data – a large share of US public water systems, but not all, and no private wells.
How to check your own system
A national snapshot is a starting point, not an answer about your home – and because most of this is the 2012-2019 record, your system’s current level may differ. Two steps:
- Check your utility in the water watchdog and read your current annual Consumer Confidence Report – it is the most up-to-date local word on every one of these contaminants.
- Match the fix to the contaminant – and the fix is often not a basic carbon filter. Our guides cover the correct treatment for arsenic, nitrate, disinfection byproducts, radium and uranium, and fluoride; the Which Filter Fits finder and the Filter Certification Registry confirm a certified option.
This completes the trilogy alongside our PFAS and lead studies: together, the honest, sourced picture of what the federal record shows about US tap water.
Methodology + source
- Source: EPA Six-Year Review (SYR4, compliance monitoring 2012-2019) + current state Drinking Water Watch (California, Florida). Public domain / public records.
- Method: For each system and each of eight regulated contaminants, we read the maximum reported result, normalized its unit to the contaminant’s standard unit, and counted the system as “over” if that value exceeded the EPA MCL. Rates are over the systems that tested for each contaminant (a non-detect counts in the denominator as “under,” not excluded). Nitrate is graded from the nitrate analyte only (the separately-reported nitrate-plus-nitrite records are not folded in, which can only lower the nitrate count). Implausibly high normalized values were dropped (artifact-guard).
- Reproducibility: every figure is computed by
beyond_pfas_lead_national_study.pyover our committed data and written tobeyond-pfas-lead-national-results.json;--checkre-runs and verifies no drift. - Integrity: no system is named as “unsafe,” no health or causal claim is made from a monitoring result, and the 2012-2019 vintage is stated throughout.
Embeddable stat (share this finding)
Beyond PFAS and lead, about 1 in 4 US water systems (22.5%) reported another regulated contaminant – arsenic, nitrate, a disinfection byproduct, or a radionuclide – over an EPA limit in the federal compliance record (a 2012-2019 snapshot of 62,245 systems). Source: WaterByTheBook analysis of EPA Six-Year Review data, waterbythebook.com.
<blockquote class="wbtb-stat">
  <p>Beyond PFAS and lead, <strong>about 1 in 4 US water systems (22.5%)</strong> reported
  another regulated contaminant -- arsenic, nitrate, a disinfection byproduct, or a radionuclide
  -- over an EPA limit (a 2012-2019 federal-record snapshot of 62,245 systems).</p>
  <cite>Source: <a href="https://waterbythebook.com/beyond-pfas-lead-national-data-study/">WaterByTheBook
  analysis of EPA Six-Year Review data</a></cite>
</blockquote>
Related guides
The 2027 EPA Lead Rule Nearly Triples the Water Systems Over the Line
Here is the honest national picture of lead in tap water, and it is not the one either…
About 1 in 9 US Water Systems Averaged PFOA or PFOS Above the EPA Limit
About 1 in 9 US public water systems -- 1,056 of the 9,235 that reported a full set…
Does a Refrigerator Water Filter Remove Lead? What NSF 53 Actually Means
Does a refrigerator filter remove lead? Sometimes – but only if that exact filter carries an NSF/ANSI 53…