Here is the honest national picture of lead in tap water, and it is not the one either side of the argument tells you. Lead 90th-percentile exceedances are rare today – in our analysis of the EPA’s lead testing record, well under 1% of water systems are over the 15 ppb action level. But the line is about to move: the EPA’s 2024 Lead and Copper Rule Improvements drop the action level to 10 ppb in 2027, and when they do, the number of systems over the line nearly triples. This is an original WaterByTheBook data study of what that change actually does, computed from the federal record with a reproducible script.
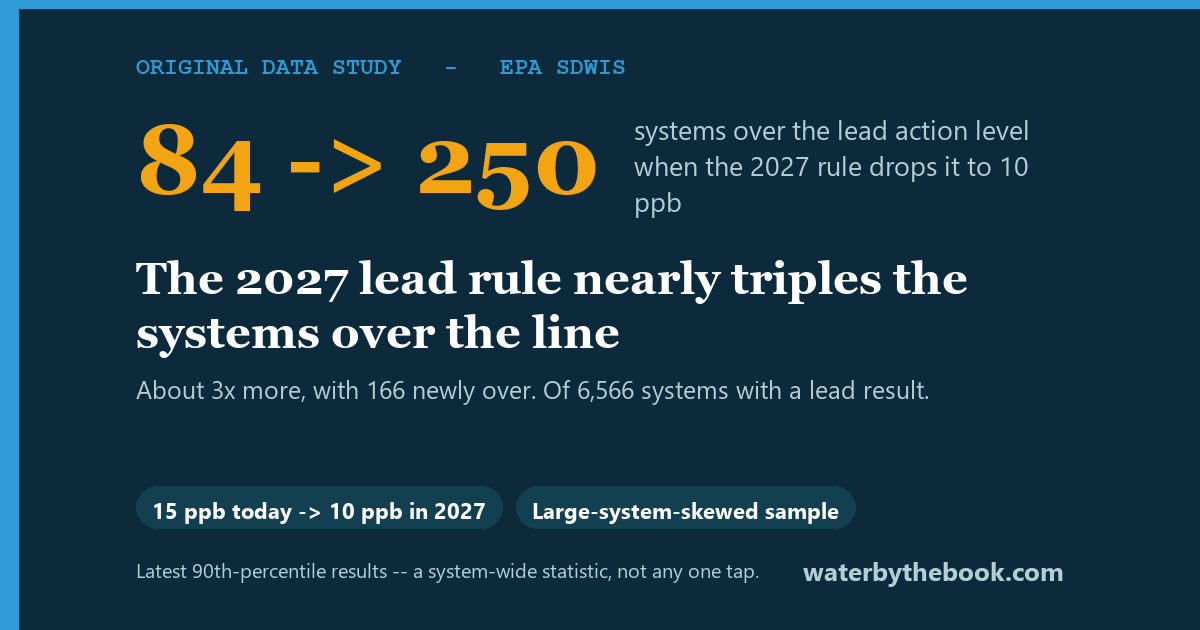
The headline: Of the 9,947 EPA-monitored public water systems we analyzed (a large-system-skewed sample, not a national census), 84 reported a latest 90th-percentile lead result above the current 15 ppb action level. Under the 10 ppb level the EPA’s 2024 rule sets for 2027, that becomes 250 – about a 3x increase – with 166 systems that are below today’s line but over the 2027 one. Lead exceedances are rare, but the bar is rising.
What this data is, and what “over the line” means
The EPA’s Safety Drinking Water Information System (SDWIS) is the federal record of what public water systems report – including each system’s lead 90th-percentile result, the number used to judge the Lead and Copper Rule. We work from our committed copy of that public-domain data. Two things have to be said plainly before any number means anything:
- The 90th percentile is a system-wide statistic, not your tap. It means 90% of the high-risk homes a utility sampled were at or below that value. Your home can be higher or lower. We never call it “your lead level.”
- The action level is a treatment trigger, not a safety threshold. Exceeding 15 ppb requires the utility to act (corrosion control, lead-line replacement, public notice). It is not a line below which water is “safe” – the EPA and CDC are clear that there is no known safe level of lead. So “over the line” means “the system must act,” not “this water is poisoned.”
What we found
The 2027 rule is the story
Today, exceedances are uncommon. Of the 9,947 systems in our universe, 6,566 reported a numeric lead 90th-percentile (the rest were non-detect or had no result on record – they cannot be “over the line”). Of those 6,566, just 84 (about 1.3%, or 1 in 80) are over 15 ppb – 0.84% of the full universe either way. The large majority report well below it: 6,300+ systems came in at or under 10 ppb, and roughly a third of all systems reported lead as a non-detect. Corrosion control, for the most part, works.
But the 2024 Lead and Copper Rule Improvements lower the action level to 10 ppb, effective November 2027. Apply that line to the same data and the count jumps:
| Action level | Systems over the line |
|---|---|
| 15 ppb (today) | 84 |
| 10 ppb (2027) | 250 |
| Newly over the line in 2027 | 166 |
That is the defensible, newsworthy finding: the 2027 rule roughly triples the number of systems over the action level, not because anything in the water changed, but because the standard tightened toward what “no safe level” actually implies. The 166 systems in the 10-to-15 ppb band are the ones to watch – compliant today, but over the 2027 line based on their most recently reported result.
Where the over-the-line systems are
By state, the systems over the 2027 line are concentrated where the infrastructure is oldest:
| State | Systems over the 2027 (10 ppb) line |
|---|---|
| Illinois | 55 |
| Pennsylvania | 17 |
| Michigan | 15 |
| New York | 14 |
| Florida | 13 |
| Wisconsin | 12 |
Illinois stands out – and that tracks with reality: Illinois has more lead service lines than any state and has been aggressively inventorying them. A high count here reflects old pipes and honest reporting, not uniquely bad water.
A caution on system size: of the systems over the 2027 line, 107 serve 10,000+ people and 143 serve fewer. Do not read that as “lead is evenly split by size.” This dataset over-represents large systems – its median system serves about 8,970 people, and 46% serve 10,000+, versus roughly 8% of US community water systems nationally. Systems under ~3,300 people, where EPA data shows lead exceedances actually concentrate, are largely absent here. So the split reflects this sample’s composition, not national prevalence – and the 250 count is, if anything, an undercount for small systems specifically.
The violations reframe: most “violations” are paperwork
“Water system violations” sounds alarming, so it is worth being precise. Across the cumulative SDWIS violation record for these systems, only about 18% of violations are health-based – the kind that means a standard was actually exceeded. The other 82% are monitoring, reporting, public-notification, and administrative violations: a required sample not collected on schedule, a notice filed late. These are not nothing – a monitoring violation means the safety data the rule requires was not gathered, and you cannot see contamination you never measured, so they are a real accountability problem. But they are not, themselves, evidence that the water was contaminated. (We cite only this outlier-robust share; the raw cumulative violation totals are all-time and inflated, so we never use them as a per-system magnitude.)
Limitations (read these before you cite the numbers)
This study is built to be defensible, which means being honest about its edges:
- This is a large-system-skewed sample, not a national census. The 9,947 systems are our resolvable, EPA-monitored universe (the same set as our PFAS study): its median system serves ~8,970 people and 46% serve 10,000+, versus roughly 8% of US community water systems nationally. Systems under ~3,300 people are largely absent – so read every count as “among the monitored systems we analyzed,” and treat the figures as an undercount of small-system exceedances, not a national prevalence estimate. It also excludes private wells entirely.
- SDWIS can lag or differ from a utility’s current CCR. The federal record is not always the utility’s latest word; a system over the line here should be confirmed against its current Consumer Confidence Report. Our watchdog flags every above-action-level reading with exactly that caveat.
- Some “latest” readings are years old. About 1 in 5 of the over-the-2027-line systems (47 of 250) have a most-recent reported round dated before 2020, a few from the 1990s. The 2027 projection assumes a system’s water chemistry still matches its last reported round.
- We excluded three implausible values. A few reported 90th-percentiles were implausibly high – a likely SDWIS data-entry error (one listed 5,000 ppb). Real utility 90th-percentiles do reach 50-60+ ppb (Newark and Benton Harbor are documented examples), and several systems here legitimately sit in the 50-97 ppb range and are kept; but a value in the hundreds to thousands is an anomaly. We treat any value above 150 ppb – the error ceiling, not the realistic maximum – as a likely data error and report it separately. There is a wide gap below the three excluded values, so the exact ceiling does not change the result, and excluding them lowers our headline rather than inflating it.
- Violation counts are cumulative (all-time) and dominated by monitoring. That is why we report the health-based share, a ratio robust to that inflation, and never per-system totals.
- We did not publish a copper figure. The federal extract’s copper values were unit-unreliable (some in the thousands of mg/L), so we excluded copper rather than publish a wrong number.
How to check your own system
A national number is a starting point, not an answer about your home. Because lead usually comes from your pipes – a lead service line, old solder, or brass fixtures – the system’s 90th percentile cannot tell you your tap’s level. Two steps:
- Check your utility’s reported lead result in the water watchdog – enter your ZIP to see the 90th-percentile and any violations on record, graded and dated, with the confirm-your-CCR caveat.
- If you want to remove lead at the tap, the fix is a filter certified to NSF/ANSI 53 for lead, verified by the exact model. Our lead guide walks through it, and the Which Filter Fits finder gets you a certified option.
This is the companion to our national PFAS study: together they are the honest, sourced picture of what the federal record actually shows about US tap water.
Methodology + source
- Source: EPA SDWIS via ECHO (the federal Lead and Copper Rule + violations record), public domain (US Government work, no reuse restriction), as of 2026-06.
- Method: For each system we read the latest lead 90th-percentile and counted exceedances of the current 15 ppb and the 2027 10 ppb action levels; values above 150 ppb were treated as likely data errors and reported separately. Violations are summarized as the health-based share of the cumulative record. Action levels are read from an auditable framework (limit + basis + as-of).
- Reproducibility: every figure is computed by
lead_violations_national_study.pyover our committed data and written tolead-violations-national-results.json;--checkre-runs and verifies no drift. - Integrity: no system is named as “unsafe,” no health or causal claim is made from a monitoring statistic, and the action level is presented as a treatment trigger, not a safety threshold.
Embeddable stat (share this finding)
The EPA’s 2027 lead rule nearly triples the number of water systems over the action level – from 84 to 250 in an analysis of 9,947 EPA-monitored water systems – as the limit tightens from 15 ppb to 10 ppb. (A large-system-skewed federal sample, so a likely undercount for small systems.) Source: WaterByTheBook analysis of EPA SDWIS data, waterbythebook.com.
<blockquote class="wbtb-stat">
  <p>The EPA's <strong>2027 lead rule nearly triples</strong> the water systems over the action
  level -- from 84 to 250 (in a 9,947-system EPA-monitored sample) -- as the limit drops from 15
  to 10 ppb.</p>
  <cite>Source: <a href="https://waterbythebook.com/lead-violations-national-data-study/">WaterByTheBook
  analysis of EPA SDWIS data</a></cite>
</blockquote>
Related guides
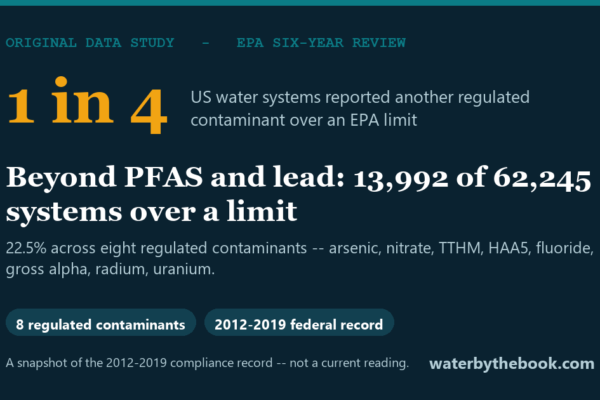
Beyond PFAS and Lead: About 1 in 4 US Systems Reported Another Contaminant Over a Limit
Correction (2026-06-29): a watchdog data-integrity audit corrected two things in the underlying data – the EPA Six-Year Review’s…
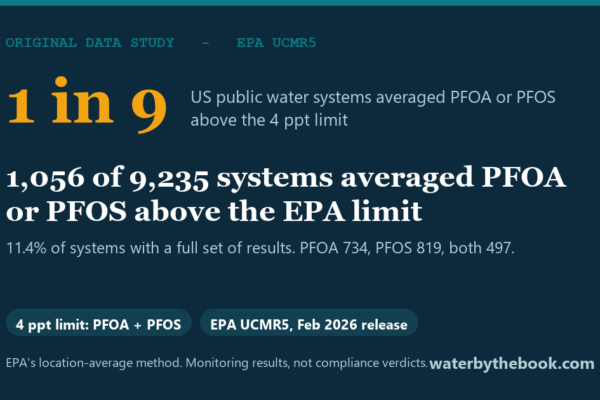
About 1 in 9 US Water Systems Averaged PFOA or PFOS Above the EPA Limit
About 1 in 9 US public water systems -- 1,056 of the 9,235 that reported a full set…
Does a Refrigerator Water Filter Remove Lead? What NSF 53 Actually Means
Does a refrigerator filter remove lead? Sometimes – but only if that exact filter carries an NSF/ANSI 53…