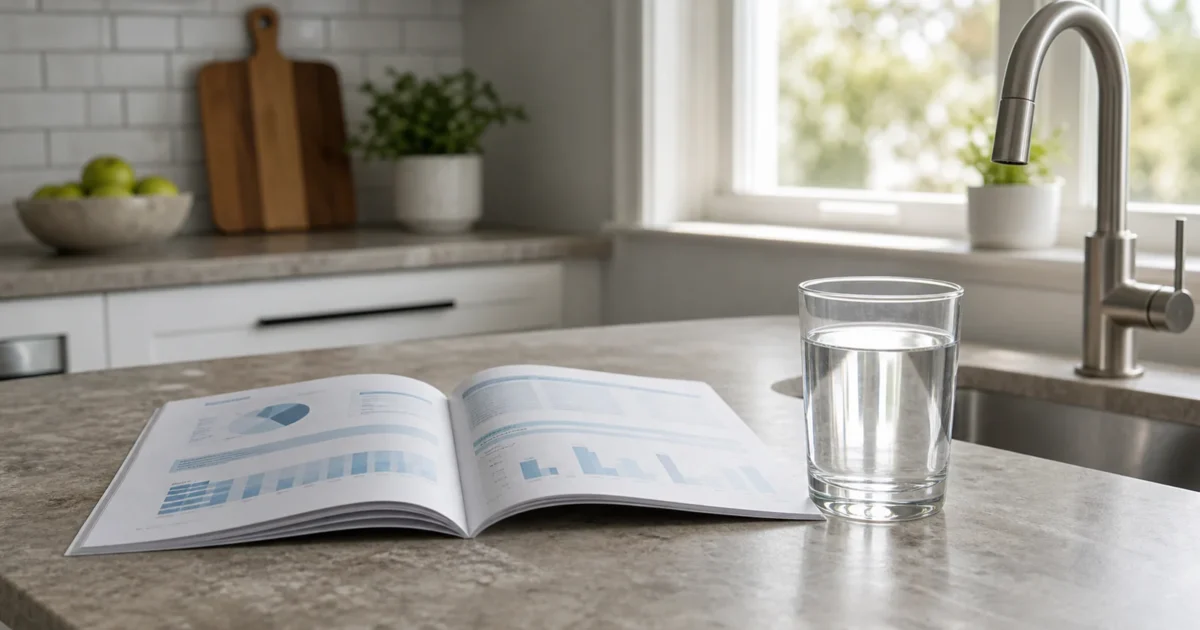
If an annual water quality report showed up in your mail or inbox recently, that is your CCR – the consumer confidence report water utilities are required to deliver to their customers by July 1 every year under the EPA’s CCR Rule. It summarizes what your utility detected in its finished water during the previous calendar year, measured against the federal drinking water standards.
The table in the middle of it is readable once you know four things: what an MCL is, what an MCLG is, what an action level is, and which unit each row uses. This guide walks through those, then covers the part most reports gloss over – what a CCR does not tell you – and what to actually do with anything you find.
What a CCR Is – and Why It Arrives by July 1
Every community water system in the United States must prepare a consumer confidence report each year and deliver it to customers by July 1, per EPA’s CCR information for consumers. The report you received in 2026 covers monitoring from calendar year 2025 – the data is always at least a few months old by the time you read it, and that vintage matters when you interpret it.
The federal requirements say the report must identify your water’s source (the lake, river, or aquifer), summarize the contamination risks to that source, list the regulated contaminants detected, explain the potential health effects of anything detected above an enforceable standard, and account for what the system did about it. It also carries standard educational language – a Cryptosporidium statement for vulnerable populations, and extra information on nitrate, arsenic, or lead where those are a local concern.
If you never received one, you do not have to wait a year. Call your utility, or use the find-your-local-CCR lookup EPA links from the consumer page above. Renters often miss the mailing entirely because the report goes to the account holder.
One honest boundary up front: if your water comes from a private well, there is no CCR. Nobody monitors a private well but its owner.
How to Read the Consumer Confidence Report Water Quality Table
The table is the heart of the report. Most versions carry some arrangement of these columns: the contaminant name, the level detected, the unit of measurement, the MCLG, the MCL (or action level), whether a violation occurred, and the likely source of that contaminant.
Three reading habits keep the table honest:
Read the unit column first. One row may be in parts per million, the next in parts per billion. A 15 in a ppb row is a thousand times smaller than a 15 in a ppm row. More on the conversions below.
Distinguish the range from the compliance value. Utilities sample many times, at many locations, across the year. Many tables show the full range of results (lowest to highest) alongside the value compliance is actually judged on – often an average across samples, or for lead and copper, the 90th percentile. A single high number at the top of a range is not, by itself, an exceedance. For the new PFAS standards specifically, the enforceable limit is a running annual average, not any single sample.
Check the violations column last, not first. A detection is not a violation. Nearly every system detects something – chlorine byproducts, trace nitrate, naturally occurring barium – at levels below the standard. The violations section lists the specific instances where the system exceeded an enforceable standard or missed a required monitoring window during the year, with the required explanation and the system’s corrective account. If that section is empty, the system met its regulatory requirements for the reporting period.
MCL vs MCLG, Action Levels, and the Units
MCLG – the health goal. The maximum contaminant level goal is the level of a contaminant below which no known or expected risk to health exists, with a margin of safety. MCLGs are non-enforceable public health goals, per EPA’s National Primary Drinking Water Regulations. For some contaminants – lead, PFOA, PFOS – the MCLG is set at zero.
MCL – the enforceable limit. The maximum contaminant level is the highest level allowed in drinking water. EPA sets MCLs as close to the MCLGs as feasible, using the best available treatment technology and taking cost into consideration. The gap between the two numbers is the honest engineering compromise printed right on your report: the goal for lead is 0, and no enforceable limit sits at the goal.
Action level – a different animal. Lead and copper are not regulated by an MCL at the tap. Instead, systems collect samples at customer taps and compute a 90th-percentile value; if that value tops the action level, the system must take treatment actions, such as corrosion control. Two things follow. First, the 90th percentile is a system-wide statistic – it is not a measurement of your faucet. Second, an action level is a treatment trigger, not a health-based safety threshold. The lead action level most current CCRs report against is 15 ppb; the 2024 Lead and Copper Rule Improvements lower it to 10 ppb effective November 2027. In our national lead study of EPA SDWIS records (June 2026 vintage), 84 systems’ latest lead 90th-percentile result was above the current 15 ppb action level – and 250 were above the 10 ppb line that takes effect in 2027, roughly a threefold jump from redrawing the line alone.
The units, converted. CCR tables mix three units, and they differ by factors of a thousand:
1 ppm(part per million) =1 mg/L– used for nitrate, fluoride, copper.1 ppb(part per billion) = one-thousandth of a ppm – used for lead, arsenic, disinfection byproducts.1 ppt(part per trillion) = one-thousandth of a ppb – used for PFAS.
So lead’s 15 ppb action level equals 0.015 ppm, and PFOA’s new 4.0 ppt limit equals 0.004 ppb. When a report feels alarming or reassuring at a glance, it is usually the units doing the work – convert before you conclude.
One more distinction worth knowing: some things in your report, like total dissolved solids at 500 mg/L, are secondary standards – non-enforceable guidelines for taste, odor, color, and staining, not health-based limits.
What Your CCR Does Not Tell You
This is the section most explainers skip, and it is where the report’s real limits live.
It is not your tap. Everything in the table describes the system’s water – at the treatment plant, in the mains, or as a 90th percentile across a sampling pool. Lead in particular usually enters water after the meter, from corrosion of household plumbing and lead service lines, per EPA’s lead in drinking water basics. A clean system-level lead number and elevated lead at one specific faucet can both be true, because the plumbing between the main and your glass belongs to the building, not the utility.
It mostly covers regulated contaminants. The table lists what federal rules require systems to monitor and report. Most PFAS compounds are not yet in that set. National PFAS occurrence data exists because of a separate monitoring program – EPA’s UCMR5 – and under the 2024 PFAS rule, systems are not required to start telling the public about PFAS levels in their reports until 2027. So a CCR with no PFAS row is normal right now, and it is not evidence of absence.
It is last year’s data. Monitoring from the prior calendar year, delivered by mid-year. Treatment changes, main breaks, and source switches since then are not in it.
It cannot see a private well. Well owners get no report at all; testing is on you.
The PFAS Gap, by the Numbers
Because the reporting requirement has not arrived yet, the national picture comes from monitoring data rather than CCRs. In 2024, EPA finalized enforceable limits of 4.0 ppt for PFOA and PFOS – with MCLGs of zero – and gave systems until 2029 to comply, per EPA’s PFAS drinking water rule page; an extension to 2031 has been proposed.
Our national PFAS study analyzed the UCMR5 occurrence data (February 2026 release, roughly 95% complete): of 10,299 public water systems tested, 1,693 – 16.4%, about one in six – reported a maximum PFOA or PFOS result above the 4 ppt limit. Two honesty notes travel with that number. UCMR5 results are individual monitoring samples, not compliance determinations – the MCL is a running annual average – and a maximum result above the limit is a flag for attention, not a verdict. And since compliance is not required until 2029, “reported above the limit” describes measurements against a standard whose deadline has not arrived.
What to Do With What You Find
The honest decision path is short, and none of it involves panic.
Name the concern. A useful concern is specific: a contaminant, its level, and the standard it was reported against – “lead 90th percentile of 12 ppb against a 15 ppb action level,” not “chemicals.” If the table shows detections below the standards and an empty violations section, the report is telling you the system met its requirements. You may still have preferences the standards do not cover – taste, an abundance-of-caution stance on PFAS – and those are legitimate reasons to filter. They are just different reasons.
Check what your system reported to the EPA. Your CCR is one year, one document. The Water Watchdog is our free ZIP-code lookup of what your water system reported in the federal records – use it to see your system’s reported results in context, and our state pages for how your state compares nationally.
Match the concern to a certified filter class – not to marketing. A filter helps only if it is certified for the specific contaminant you care about. For lead, that means NSF/ANSI 53 (or NSF/ANSI 58 for reverse osmosis) with lead named in the listing. For PFOA/PFOS, look for NSF/ANSI 53 or 58 certifications that name PFOA/PFOS reduction. Our filter certification registry maps common concerns to certified filter classes, and the distinction that matters is NSF-listed versus manufacturer-claimed: a claim you can verify in the NSF certification database is worth more than a claim printed on a box. Certification is SKU-specific – verify the exact model, not the brand.
Then pick the format that fits your household. Pitcher, faucet-mount, under-sink, or point-of-entry is a fit-and-budget decision, not a purity contest. Our filter finder walks that decision. Whatever you land on, confirm the exact model number against its certification listing before you buy.
Quick Reference: Six Terms That Decode the Table
| Term | What it is | What it is not |
|---|---|---|
| MCLG | Non-enforceable health goal, with margin of safety | A legal limit |
| MCL | Enforceable limit, set as close to the MCLG as feasible | A guarantee of zero risk |
| Action level | Treatment trigger for lead/copper at the 90th percentile | A safety threshold, or your tap’s reading |
| 90th percentile | System-wide statistic from tap sampling | A measurement of your faucet |
| ppm / ppb / ppt | Units, each 1,000x smaller than the last | Interchangeable |
| Range vs average | All results vs the compliance value | A high range-end is not, alone, an exceedance |
When is the consumer confidence report delivered?
By July 1 each year, covering the previous calendar year’s monitoring, per EPA’s CCR Rule. If you did not receive one, call your utility or use EPA’s find-your-local-CCR lookup – reports also usually live on the utility’s website.
What is the difference between an MCL and an MCLG?
The MCLG is the non-enforceable health goal – the level below which no known or expected health risk exists. The MCL is the enforceable limit, set as close to the goal as treatment technology and cost feasibly allow. For lead, PFOA, and PFOS the goal is zero, so the two numbers are never the same.
Does a detection in my CCR mean I need a filter?
Not by itself. Nearly every system detects something below the standards, and the report exists to show those numbers against the limits. A filter decision starts with a specific concern – a named contaminant and its level – matched to a filter class certified for that contaminant, which is what the certification registry is for.
Why is there no PFAS in my water quality report?
Systems are not required to include PFAS results in public reports until 2027 under the 2024 rule, so most current CCRs are silent on it. National occurrence data comes from EPA’s UCMR5 monitoring program instead – in that data (Feb 2026 release), 1,693 of 10,299 systems reported a maximum PFOA or PFOS result above the 4 ppt limit.
Does the CCR measure lead at my faucet?
No. Lead is reported as a 90th-percentile statistic from a pool of customer-tap samples – a system-wide number. Lead typically enters water from a building’s own plumbing and service line, so your faucet can differ from the system statistic in either direction. If lead is your concern, an NSF/ANSI 53 filter certified for lead – confirmed against the exact model’s listing – addresses the water you actually drink.
Do private wells get a consumer confidence report?
No. The CCR Rule covers community water systems. A private well has no utility, no monitoring requirement, and no report – testing and treatment decisions belong to the well owner.
Related guides
Boil-Water Advisory Checklist: What to Do During and After [2026]
A boil-water advisory checklist only works if you follow it in the right order, and the order is…
Boil-Water Advisory: What Your Filter Can and Cannot Do
Your phone buzzes with a boil-water advisory, and your first instinct is to check the pitcher filter on…
NSF Filter Certifications Explained: 42 vs 53 vs 58 vs 401 vs P473
NSF filter certifications only mean something when two conditions are both true: the exact product is listed by…